

 Download
 Buy
BuyMaxDB Maestro online Help
| Prev | Return to chapter overview | Next |
Customizing diagram properties
Diagram Viewer provides a special control for customizing the diagram properties. This control is located in the Properties group of the Navigation Bar and consists of four separate subgroups:
Appearance
Contains properties responsible for major diagram appearance:
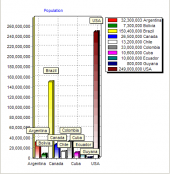
| • | Chart type - defines a way of how the diagram will be represented: as bars, lines, areas, points, pies, or fast lines |
| • | Color each points - if checked, each bar, point, line or sector of the diagram has an individual color; if not checked, all the points are colored red |
| • | Show axis - defines if the diagram has the axis and background grid or not |
Data
Contains the Labels source property which allows you to specify the field for X-axis labels as well as for diagram point marks .
Titles
Contains properties for defining titles for different parts of the diagram:
| • | Header - defines the title appeared on the top of the diagram |
| • | X-axis and Y-axis - define the titles for diagram axis |
| • | Show marks - defines if the diagram point marks are visible or not |
Legend
The only Visible property of this subgroup specifies whether the legend rectangle should be represented on the right side of the diagram or not.
| Prev | Return to chapter overview | Next |